• Platform
    • Product
      • Platform Overview
      • Flex Framework
      • AI Capabilities
      • Featured Customers
      • Marketplace
    • Industries
      • Healthcare
      • Education
      • Government
      • Financial Services
      • Energy and Utilities
      • Nonprofits
      • Media
      • Consulting
    • Get Started
      • Free Trial
      • Get a Custom Demo
      • Contact Sales
  • Resources
    • Resources(inner)
      • Resource Center
      • Marketplace
      • Blog
      • Events
    • Plan for Success
      • Free Training
      • Onboarding
      • Professional Services
      • Partner Directory
  • Pricing
  • search
  • Contact Sales
  • Support
    • Online Help
    • Community Forum
    • Contact Support
  • Log in
Get a Demo Try Free
High Contrast
Caspio logo Try Free
  • Platform

    The Caspio Low-Code Platform

    • menu-product-icon[1]
      Product
      • Platform Overview
      • Flex Framework
      • AI Capabilities
      • Featured Customers
      • Marketplace
    • industries-icon
      Industries
      • Healthcare
      • Education
      • Government
      • Financial Services
      • Energy and Utilities
      • Nonprofits
      • Media
      • Consulting
    • get-started-icon
      Get Started
      • Free Trial
      • Get a Custom Demo
      • Contact Sales
  • Resources

    All the Tools and Support You Need

    • menu-resources-icon[1]
      Resources(inner)
      • Resource Center
      • Marketplace
      • Blog
      • Events
    • menu-plan-for-success-icon[1]
      Plan for Success
      • Free Training
      • Onboarding
      • Professional Services
      • Partner Directory
  • Pricing
  • High Contrast
  • search
  • Contact Sales
  • Support
    • Online Help
    • Community Forum
    • Contact Support
  • Log in
Get a Demo Try Free

How to Transform Your Data Into Rich Visualizations [Video]

September 4, 2017

  • Tech Tips
  • Customer Spotlight
  • News Articles
Try Free
  • Home
  • Blog
  • Current Article
11159
September 4, 2017

Data geeks find spreadsheets sexy. Somehow, seeing numbers perfectly arranged in color-coded columns and matrices, with intricately-designed formulas to gain insights, is oddly satisfying — at least for them. Of course, that’s not the case for everyone. Most people think of spreadsheets as a trusty way to organize data that enables more efficient reporting of important information and statistics. In this sense, spreadsheets are the good ol’ Corollas of the data world — straightforward and dependable.

However, there will be times when you and your customers need a way to see that data in a more visually appealing way. You need something that can make their heads turn like a Ferrari reflecting a ray of sunlight on a beautiful day as it zooms by. That’s where data visualization comes in. Turning your raw data into visually appealing charts and graphs is like trading in your trusty Corolla for a flashy Ferrari — and not just any Ferrari, a “LaFerrari.”

Far being an intimidating task, it’s easy to visually represent your data. The first step is to find the right tool that balances performance and ease of use. Fortunately, Caspio’s platform gives you a comprehensive data management solution with built-in visualization and dynamic reporting tools.

YouTube image 1

The next step is to figure out which chart or graph best represents your data. The level of information you choose to share with your audience differs depending on their needs and concerns. As they say: “Show, don’t tell.” Keep things interesting by pulling up an interactive chart, but don’t let the medium distract the audience from the message. Here are five examples of more advanced chart designs that you can generate with Caspio, and how you can use them to make richer, more insightful reports.
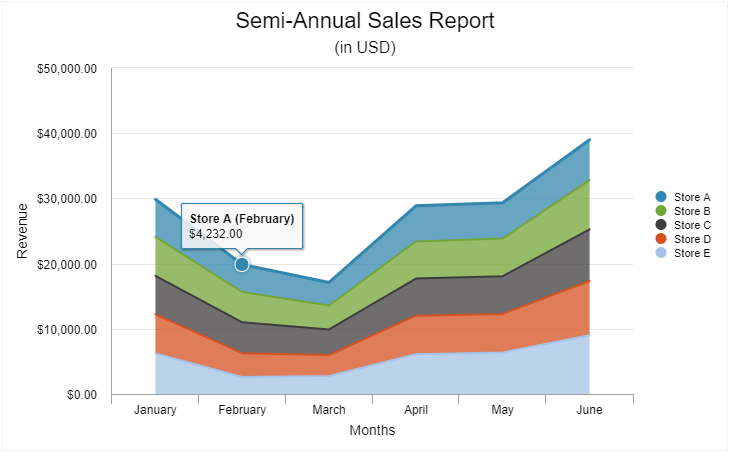
Stacked Area Chart

A stacked area chart, like the example below, is helpful in analyzing both individual and overall trends. It’s a good representation of part-to-whole relationships, such as showing individual and total revenues made by a chain of stores over a period of time.
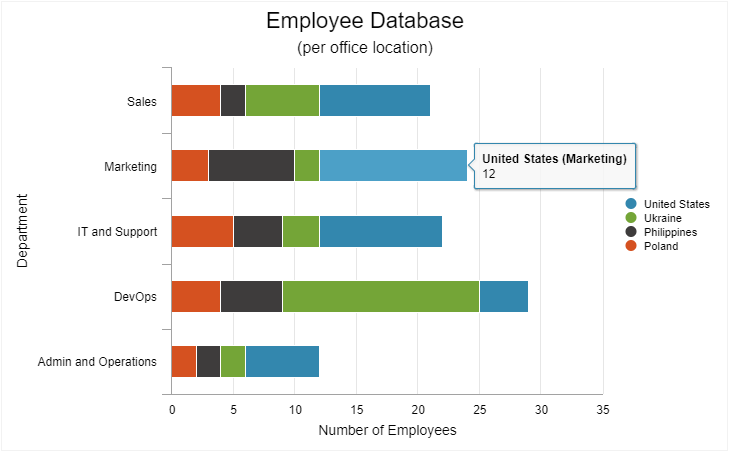
Example of Stacked Area Chart

Stacked Bar

Stacked bar charts are best used to compare data sets while also showing the composition of each data set. For example, you may want to compare departments by the total number of employees while also showing the regional composition within each data set.
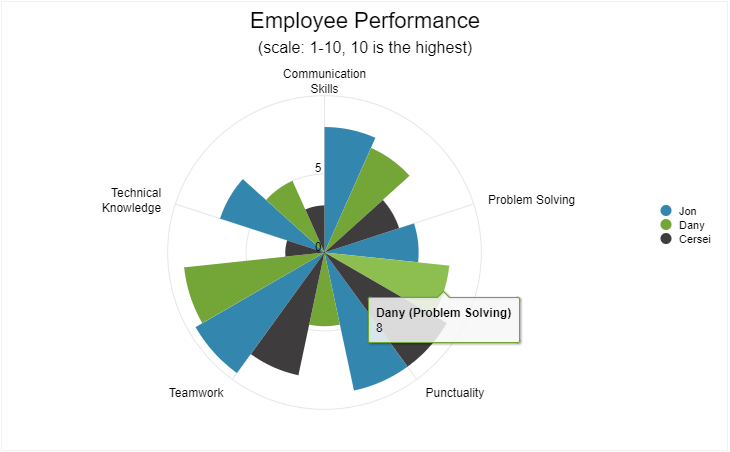
Example of a Stacked Bar Chart in Caspio

Polar Chart

A polar chart is helpful in comparing multiple variables. Use this to illustrate the success of a program or to evaluate the attributes of employees based on different traits or factors.
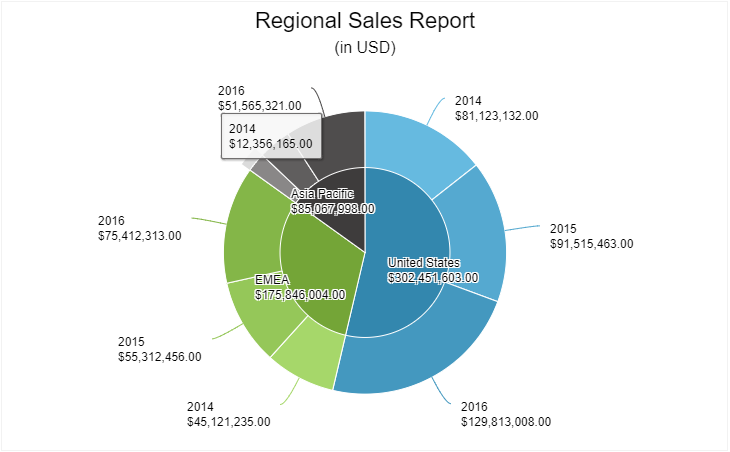
Example of a Polar Chart in Caspio

Donut Chart

A donut chart is an upgraded version of a pie chart. The outer area functions as a regular pie chart, while the inner area shows broader groupings of data for a more macro perspective. Take a look at the example below, which shows a comparison of sales revenue per region and year.
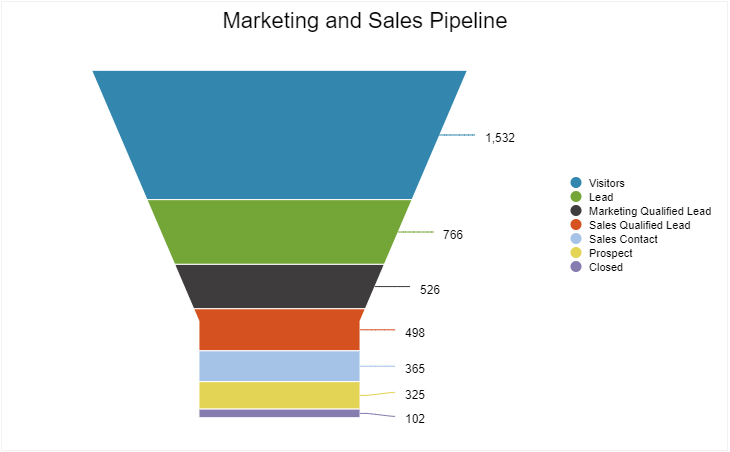
Example of a Donut Chart in Caspio

Funnel Chart

A funnel chart best represents data as steps toward completion. For instance, a funnel chart will allow you to track the marketing process and its impact on sales revenue.

Example of a Funnel Chart in Caspio

Caspio low-code application development platform provides business users with complete data management and visualization features to bring your data to life. It has more than 20 charts including area, funnel, pyramid, polar, radar and combination charts for bigger and more complex data analysis projects.

Need help to complete your next data visualization project? You may request a demo from one of our product experts or sign up for a free trial to start exploring the platform.

Call to Action Block Call to Action Block

Share this post:

Previous Post:
Video: A Walk Through on How to Create Database Relationships in Caspio
Next Post:
The Best Way to Send SMS Alerts From Your Web App [Video]

Recommended Articles

From Spreadsheets to Automation: How Marriott International Scaled With Caspio  

How Marriott International Scaled With Low Code

READ STORY
10 Questions to Ask Before Choosing Hospital Management Software

10 Must-Ask Questions Before Choosing Hospital Management Software

READ STORY
Outperform in Uncertainty: How Smart Companies Are Scaling With Less

Outperform in Uncertainty: How Smart Companies Are Scaling With Less

READ STORY
HIPAA-Compliant Caspio App Cuts Occupational Therapy Reporting Time by 80%

HIPAA-Compliant App Cuts Occupational Therapy Reporting Time by 80%

READ STORY
Caspio Turns 25: A Journey of Growth, Innovation and Impact

Caspio Turns 25: A Journey of Growth, Innovation and Impact

READ STORY
Beyond Excel: How a Healthcare Consulting Company Rebuilt Its Workflows With Caspio 

How a Healthcare Management Company Rebuilt Its Workflows With Low Code

READ STORY
How Illinois Orthopedic Network Embraces Low Code for Improved Data Management 

How ION Embraces Low Code for Improved Data Management | Caspio

READ STORY
10 Practical Ways to Use AI in Your Caspio Apps

10 Practical Ways to Use AI in Your Caspio Apps

READ STORY
Send Instant Updates From Caspio to Slack Channels

Send Instant Updates From Caspio to Slack Channels

READ STORY
How Caspio Partner WorkMovr and Healthier Pets Redefine Pet Wellness With Low Code

WorkMovr + Healthier Pets: Redefining Pet Wellness With Low Code

READ STORY
Introducing Flex: A Modern Way to Build Apps

Introducing Flex: A Modern Way to Build Apps

READ STORY
Announcing Caspio’s New AI Capability

Announcing Caspio's New AI Capability

READ STORY
Subscribe for More Updates
  • PRODUCT

  • Platform Overview
  • Why Low Code
  • Case Studies
  • App Marketplace
  • Pricing
  • Get a Custom Demo
  • Free Trial
  • SOLUTIONS

  • Healthcare
  • Education
  • Government
  • Financial Services
  • Energy and Utilities
  • Nonprofits
  • Media
  • Consulting
  • RESOURCES

  • Resource Center
  • Blog
  • Free Training
  • Online Help
  • Onboarding
  • Get Certified
  • Professional Services
  • Managed Application Services
  • Support Center
  • COMPANY

  • Our Story
  • Careers
  • Leadership
  • News
  • Partner Programs
  • Referral Program
  • Academic Program
  • Discount Programs
  • Contact Us
  • TRENDING

  • Build Custom CRM
  • Create Web Dashboards
  • Best Online Database
  • Convert Excel to Web
  • Go Paperless With Web Forms
  • Migrate MS Access Online
  • HIPAA Compliant Database
  • Create a Patient Portal
Caspio Logo

Caspio is the world’s leading cloud platform for building online database applications without coding.
Start a free trial today and experience the power of no-code.

Footer Partners

© 2025 Caspio, Inc. Sunnyvale, California. All rights reserved.

  • Privacy Statement
  • Terms of Use
  • Report Abuse
  • Sitemap
  • Feedback